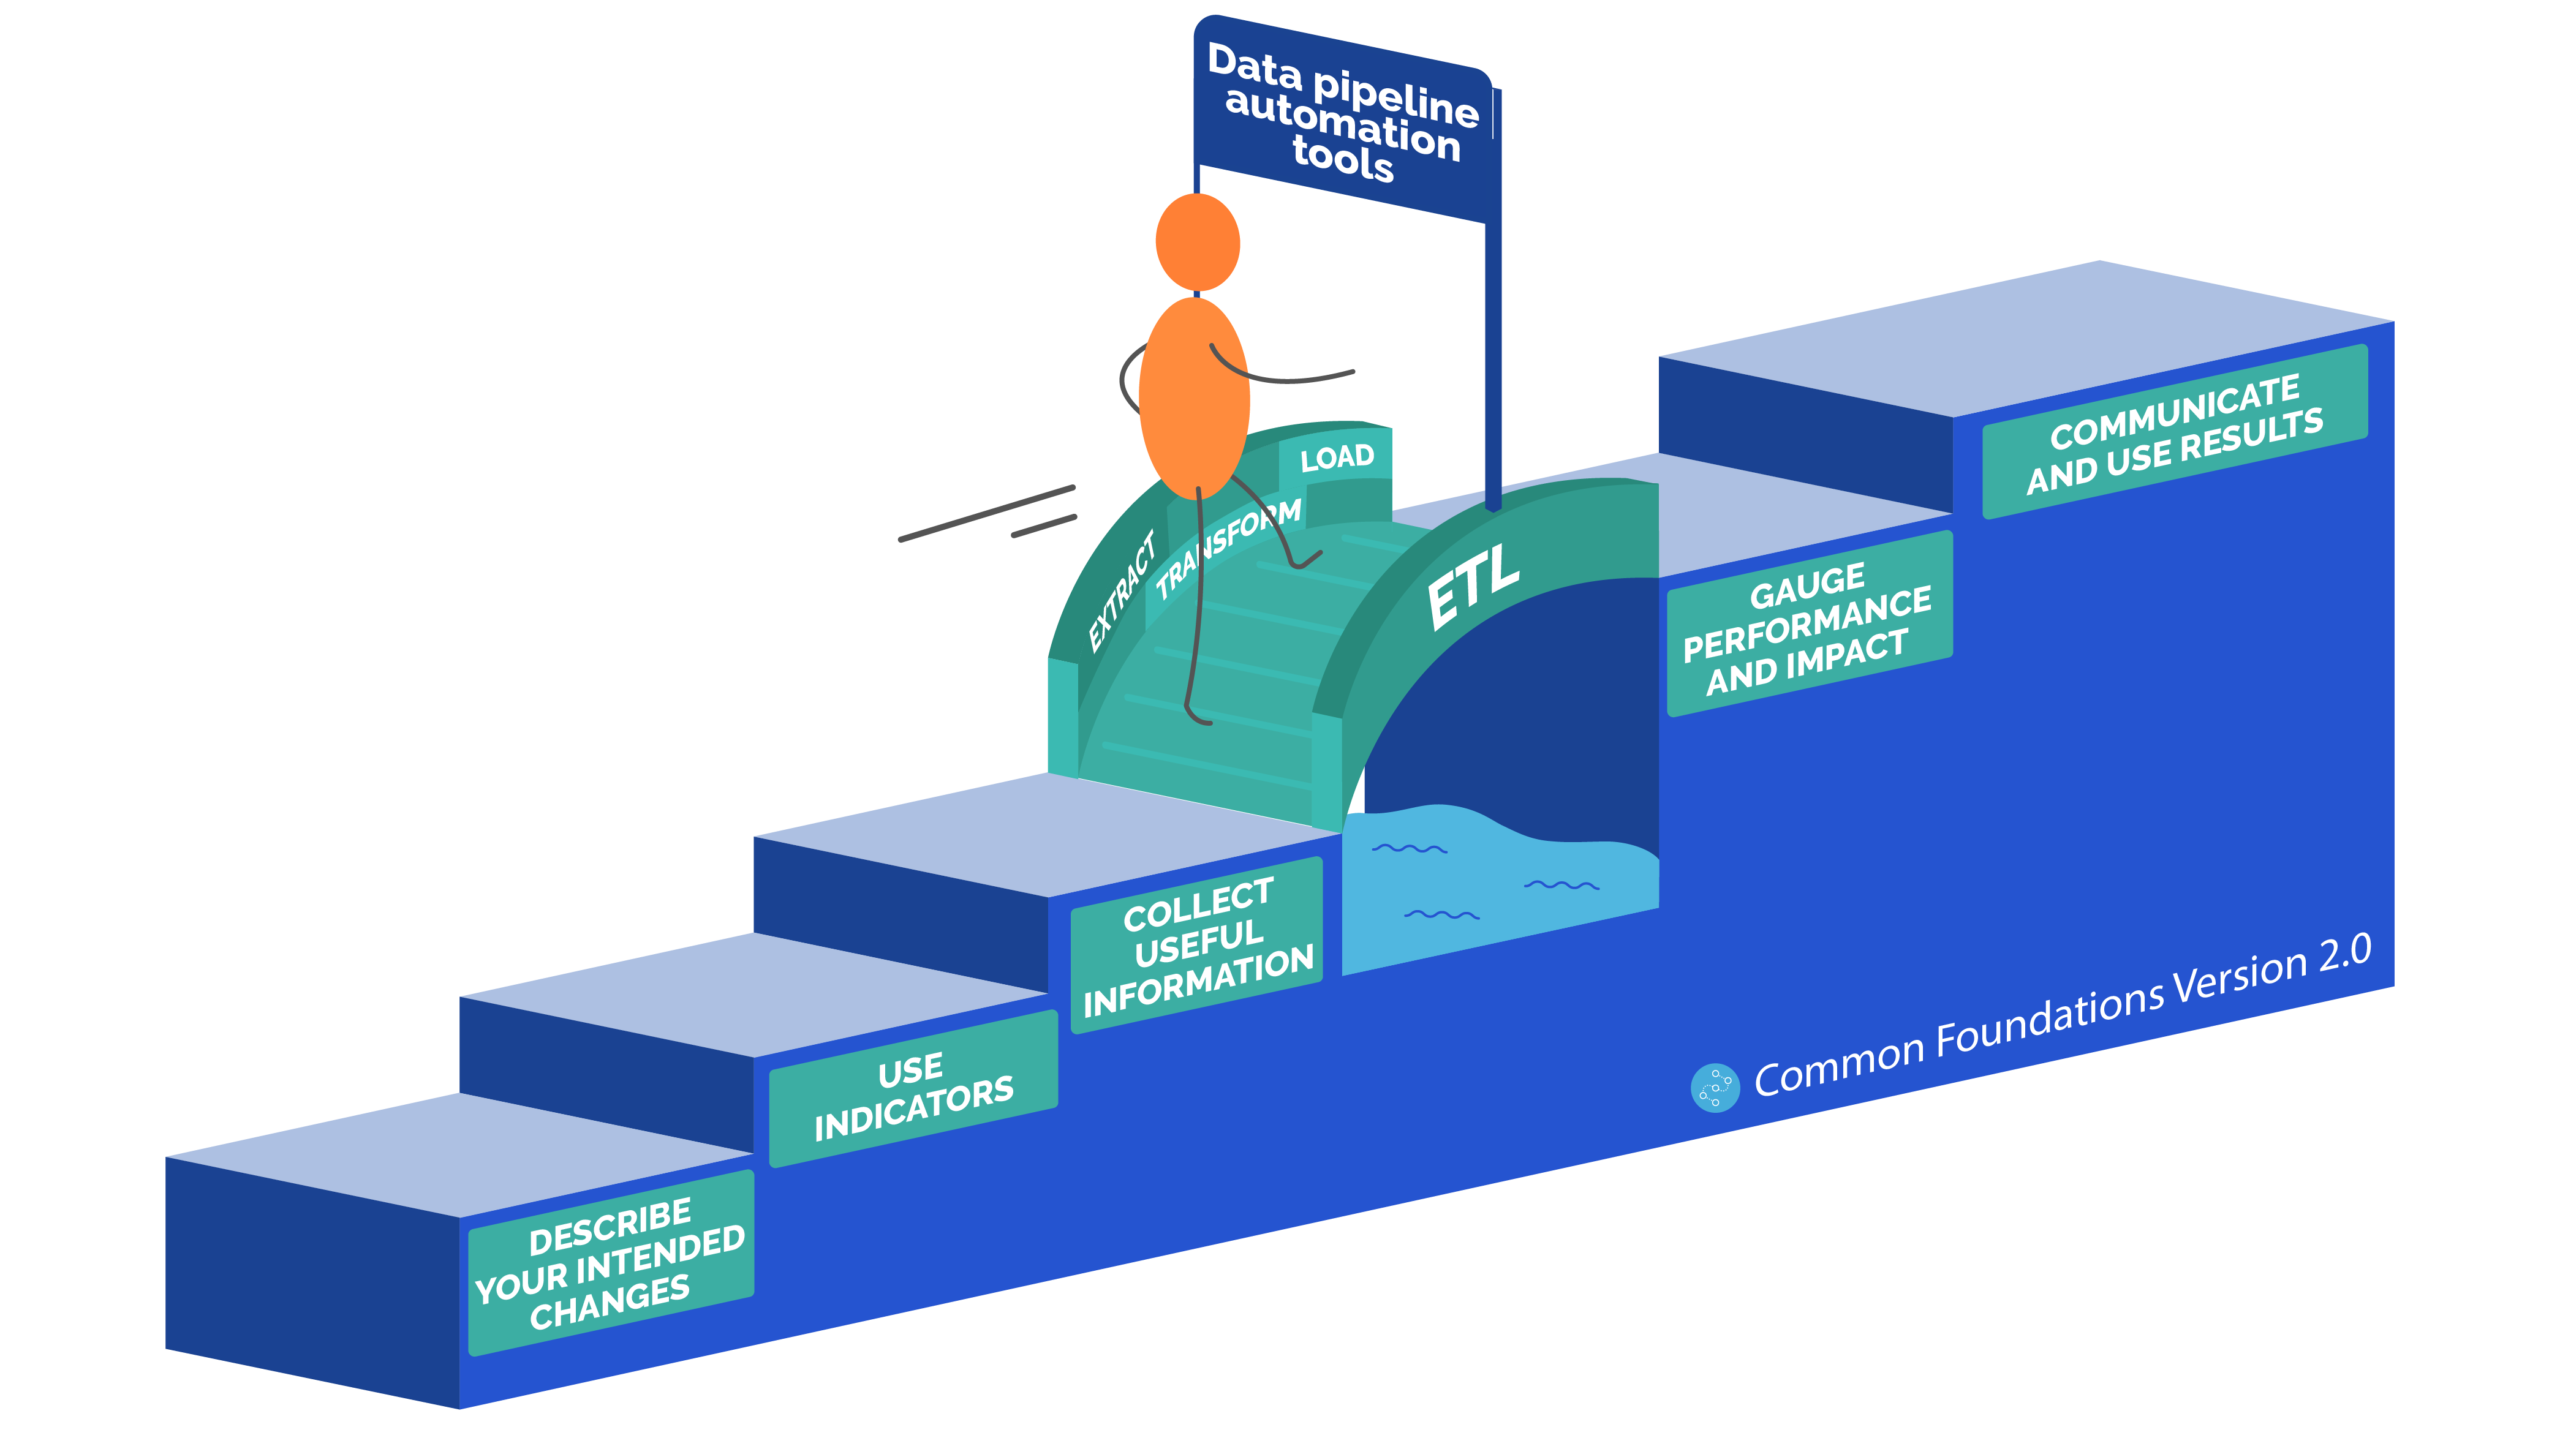








The Pathfinder Pilot has led Common Approach to an important realization: ETL pipelines were one of—if not the—primary impact measurement pain point in measuring impact for participating social purpose organizations (SPOs). For organizations that were already collecting data, the core difficulty they faced in impact measurement was, and is, the painstaking work of amassing individual-level and event-level data into metrics. We believe this challenge is a systemic issue impacting the entire charitable, social innovation, and social finance sector, hindering effective impact measurement, digital adoption, and program efficiency.
What are ETL pipelines?
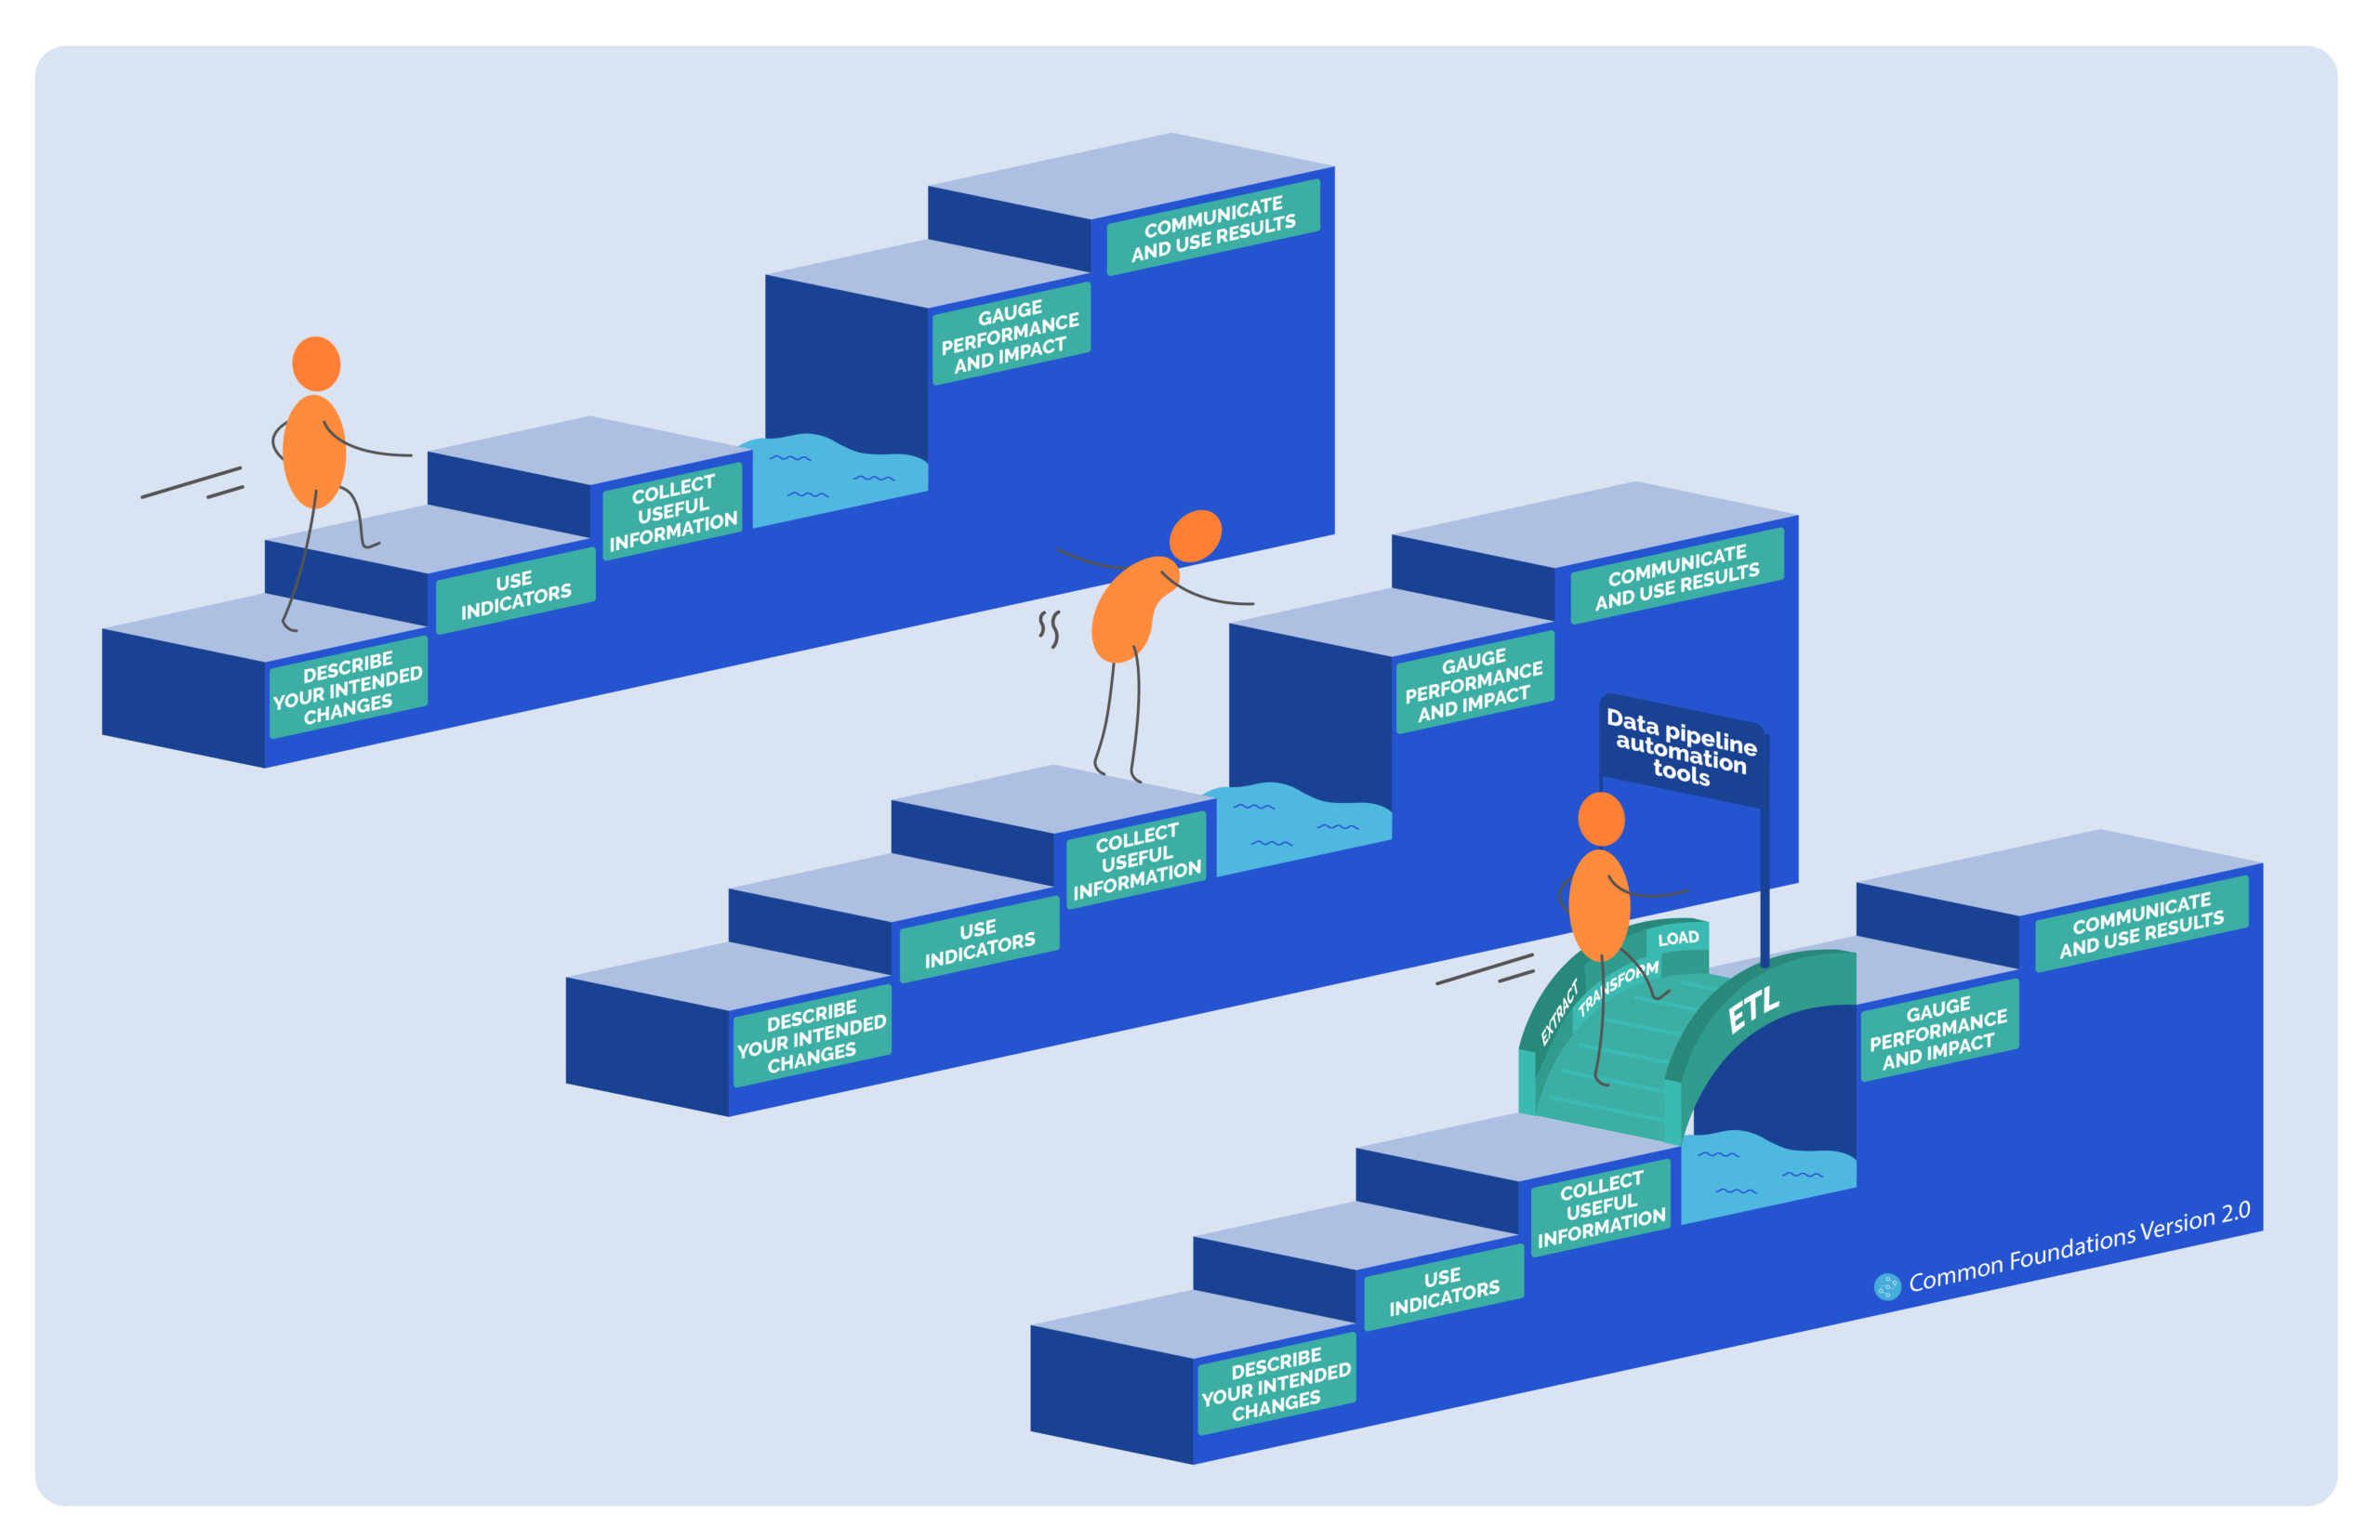
ELT stands for extract, transform and load. The “pipeline” refers to a sequence of steps where data is taken from its raw form, usually individual-level or event-level data, and cleaned and structured into a format suitable for aggregation into metrics. This process can range from simple data aggregation to highly complex operations involving multiple datasets and intricate calculations.
A simple output metric can take 60 minutes. A complex impact metric can sometimes take an experienced data analyst days to complete. An organization tracking 15 quarterly metrics could easily spend two weeks a year solely on data transformations, excluding data collection, visualization, and decision-making. By illuminating this critical pain point, we hope that Common Approach can catalyze more effective, targeted solutions.
Simple ETL pipeline example: Maple Tree Society
Maple Tree Society is a small organization with only a few employees, moderate digital maturity, and a stable set of strategic priorities to track and report to the board.
One of the metrics for one of the strategic priorities is “number of attendees at Maple Tree events.” This seemingly straightforward metric requires combining attendance data from Eventbrite (for online events) and internal Excel files (for in-person events). The transformation steps include:
- Extraction: Downloading .csv files from Eventbrite and collecting in-person attendance lists via email.
- Transformation: Opening files, copying and pasting data, using simple count formulas, creating new tables, linking or transcribing data, and summing totals.
- Loading: Copying and pasting the final calculated number into a dashboard or report.
This seemingly simple process takes Maple Tree Society 45 to 60 minutes per reporting period for just one metric. With over 15 metrics, compiling annual data becomes a major undertaking (1-2 full days), often resulting in data being used only for year-end reporting rather than for ongoing monitoring or management.
Complex ETL pipeline example: White Oak Alliance
White Oak Alliance is a mid-sized organization with 40+ employees and high digital maturity. They have a full-time evaluator on staff.
White Oak seeks to track the “Percentage of evictions prevented through services.” This requires integrating data from two sophisticated databases: the Accountability and Resource Management System (ARMS), which tracks eviction prevention services, and the Homeless Individuals and Families Information System (HIFIS), which tracks housing status. The complexity arises from:
- Extraction: Running specialized reports from both ARMS and HIFIS, often requiring staff with specific expertise.
- Transformation: Downloading .csv files, opening them in Excel, reformatting data for consistency, identifying unique individuals across datasets, using advanced VLOOKUP functions to merge data, cleaning omissions by contacting caseworkers, and performing final calculations for numerator, denominator, and percentage.
- Loading: Recording the final percentage in a report.
This complex transformation can take White Oak Alliance over 1 hour per quarter for a single metric. As a multi-service agency with numerous programs and metrics, White Oak often only tabulates what is mandated by funders, leading to significant underutilization of their collected data for internal learning and improvement.
The sector-wide ramifications
This ETL pipeline challenge extends far beyond the Pathfinder Pilot participants. It is a fundamental impediment to effective data utilization across the entire charitable, social innovation, and social finance sector.
Evidence of a shared problem
Leaders from across the sector, including representatives from data organizations, philanthropic partners, and intermediaries, consistently echo this challenge. They identify it as a fundamental and significant problem that deeply resonates with their own experiences and observations of the systemic barriers facing social purpose organizations.
Charity Navigator and Impact Matters: “We have struggled with this.”
Purpose Analytics: “This is the biggest problem we see.”
Ontario Trillium Foundation: “We’re not surprised. We see this.”
LIFT Impact Partners: “This definitely resonates with what we have observed in our work with SPOs. The document has captured the nuance of the issue really well.”
The 2020 Data Empowerment Report from the Nonprofit Technology Enterprise Network (NTEN) indirectly highlights the ETL pipeline challenge, noting that a vast majority of organizations have 25% or fewer staff capable of running custom reports (page 23).
Implications
The inability to efficiently convert individual and eventlevel data into metrics means that SPOs and social finance intermediaries (SFIs) are unable to convert collected data into meaningful insights. This has several critical implications:
- Limited data utilization: SPOs often collect vast amounts of data but are unable to use it for strategic decision-making or learning beyond basic reporting requirements.
- Siloed information: Data remains locked within disparate systems, making comprehensive analysis and cross-program insights nearly impossible.
- High costs: The manual, time-intensive nature of transformations makes data collection and reporting cumbersome and costly.
- Barriers to data sharing: Without standardized, transformed data, meaningful data sharing across organizations or with funders remains a significant challenge.
A world of solutions, but no resolution
There are solutions to the ETL pipeline challenge. Data scientists and business intelligence professionals report that these solutions are widely available and can be adjusted to various budgets. There are better ways for Maple Tree Society and White Oak Alliance to do their work, available at prices they could afford. And yet the ETL pipeline challenge persists.
Existing solutions include:
- Automations using Integration Platform as a Service (iPaaS) tools with platforms like Zapier, IFTTT, Make (formerly Integromat), and Workato, which can connect different software applications and automate tasks.
- Tailored scripts to extract reports, perform transformations, and export formatted data. Purpose Analytics, for instance, has developed such apps for HIFIS users.
- Optimize process flows to streamline manual steps and reduce inefficiencies.
- Consolidating data into fewer platforms to reduce the number of data sources.
- Making better use of existing platform features by leveraging underutilized functionalities within current software.
- Hiring a consultant and bringing in external expertise to set up data systems. While some SPOs have good luck with this, there are more stories of frustrating engagements. It highlights that money is often available to solve data problems, but even with money, the solutions feel out of reach.
- Developing internal capacity by empowering staff to manage data.
Key hurdles
If the solutions are prevalent and the ETL pipeline challenge is prevalent, then there are other problems preventing the solutions from reaching the organizations in need. Common Approach hypothesizes that these are the solution-blocking hurdles:
- Lack of precise language: SPOs often describe “measurement” or “reporting” challenges, rather than pinpointing “ETL Pipeline” or “data transformation”. This imprecise language leads to generic solutions (like impact measurement software) that don’t address the core problem. If SPOs could articulate the specific transformation hurdles, they could seek more targeted help and avoid rehashing foundational elements like theories of change or KPIs with every new consultant.
- The obfuscating term “capacity building”: Too often, problem identification stops at the term “capacity”. Capacity for what, exactly? “Impact measurement” is too broad. “Data transformation” is too broad. Instead, we can look at the solution blocks: lack of expertise in setting up and maintaining an iPaaS tool, insufficient expertise to identify, hire, and supervise an effective consultant, or limited expertise in management information systems development.
- Difficulty in solution segmentation: Neither solution providers nor intermediaries (trainers, capacity builders) currently possess a clear framework to help SPOs identify the right solution for their specific data transformation problem. Determining whether an SPO needs process optimization, iPaaS tools, or a custom application requires someone with a good overview of the range of solutions and which data transformation problems the solutions are best suited to. Developing and disseminating such a framework—a questionnaire or rubric—is a significant undertaking.